
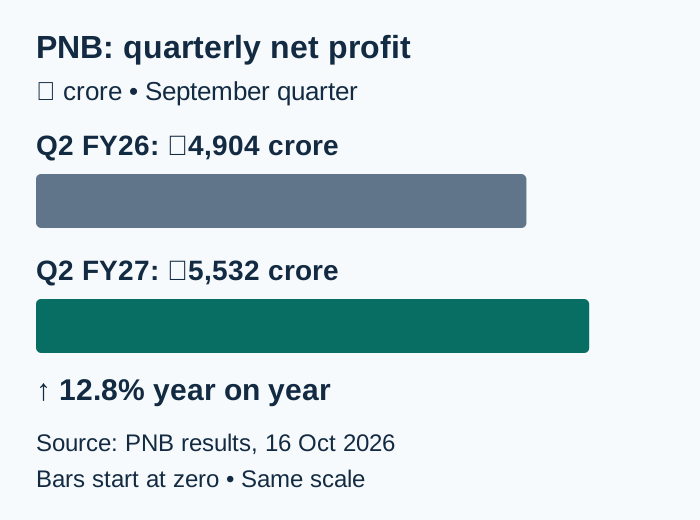
Punjab National Bank (PNB) reported a 12.8% year-on-year increase in net profit to ₹5,532 crore for the second quarter of financial year 2026-27 (Q2 FY27), compared with ₹4,904 crore in the corresponding quarter last year. The state-owned lender’s results for the quarter ended September 30, 2026, also showed growth in net interest income, expanding credit demand and improvements in asset quality. Net interest income (NII) rose 10.8% to ₹11,601 crore, while operating profit increased 4.2% to ₹7,532 crore.
The results indicate continued earnings growth as PNB expands lending to retail customers, agriculture businesses and micro, small and medium enterprises (MSMEs). Its global advances increased 14.7% year-on-year to ₹13.41 lakh crore, while the gross non-performing asset (GNPA) ratio declined to 2.55%. However, the bank’s slippage ratio, which measures fresh bad-loan formation, edged higher year-on-year. Investors will therefore be watching whether credit growth and improving asset quality can continue to support profitability in the coming quarters.
Key Takeaways
- Net profit: Increased 12.8% year-on-year to ₹5,532 crore from ₹4,904 crore.
- Net interest income: Rose 10.8% to ₹11,601 crore.
- Operating profit: Increased 4.2% to ₹7,532 crore.
- Asset quality: GNPA ratio improved to 2.55%, while the net NPA ratio fell to 0.25%.
- Credit growth: Global advances increased 14.7% to ₹13.41 lakh crore.
- Deposits: Global deposits grew 9.9% to ₹17.77 lakh crore.
- Net interest margin: Global NIM improved to 2.58% from 2.50% in the previous quarter.
- Watchpoint: The slippage ratio rose to 0.77% from 0.71% a year earlier.
PNB Q2 FY27 Financial Results: Key Numbers
PNB’s September-quarter performance showed growth in profit and core interest income, alongside a more moderate increase in operating profit. The following table compares the main reported figures with the same quarter of the previous financial year.
| Financial metric | Q2 FY27 | Q2 FY26 | Year-on-year change |
|---|---|---|---|
| Net profit | ₹5,532 crore | ₹4,904 crore | +12.8% |
| Net interest income | ₹11,601 crore | ₹10,469 crore | +10.8% |
| Operating profit | ₹7,532 crore | ₹7,227 crore | +4.2% |
| Total income | ₹38,185 crore | ₹36,214 crore | +5.4% |
| Interest income | ₹34,585 crore | ₹31,872 crore | +8.5% |
| Global business | ₹31.18 lakh crore | ₹27.87 lakh crore | +11.9% |
| Global deposits | ₹17.77 lakh crore | ₹16.17 lakh crore | +9.9% |
| Global advances | ₹13.41 lakh crore | ₹11.70 lakh crore | +14.7% |
Source: PNB’s Q2 FY27 results and reporting published on October 16, 2026. Figures are rounded where appropriate.
Net profit grew faster than total income, suggesting that the bank’s overall earnings benefited from more than just an increase in its revenue base. However, understanding the precise drivers requires examining interest income, funding costs, provisions and other expenses together.
Net Interest Income Grows 10.8%
Net interest income is one of the most important indicators for a bank. It represents the difference between interest earned on loans and investments and interest paid on deposits and borrowings.
PNB’s NII increased to ₹11,601 crore from ₹10,469 crore in Q2 FY26. The growth reflects the importance of lending activity and the bank’s ability to generate income from its interest-earning assets.
For lenders, NII growth depends on several factors, including loan demand, the interest rates charged to borrowers, deposit rates and the composition of the loan book. A bank can expand its lending rapidly but still face pressure on NII if funding costs rise too quickly or lending yields decline.
PNB’s global net interest margin (NIM) stood at 2.58% in Q2 FY27, compared with 2.50% in the preceding quarter. NIM measures the spread between interest income and interest expense relative to interest-earning assets.
The sequential improvement is a positive operating indicator, although the margin’s direction over the next few quarters will depend on deposit repricing, lending rates and the broader interest-rate environment.
Operating Profit Rises 4.2%
PNB’s operating profit increased to ₹7,532 crore from ₹7,227 crore a year earlier, a rise of 4.2%.
Operating profit reflects the bank’s performance before accounting for provisions and certain other items that affect the final net profit. Its growth was slower than the increase in net profit, making the movement in provisions and other below-operating-profit items important when interpreting the results.
Banks set aside provisions to cover potential credit losses and other risks. When the amount required for provisions changes, net profit can move differently from operating profit.
For PNB, investors will need to track the relationship between operating profit, credit costs and net profit over several quarters rather than assume that the latest increase in earnings will automatically repeat.
The bank’s total income rose 5.4% to ₹38,185 crore, while interest income increased 8.5% to ₹34,585 crore. These figures provide additional context for the improvement in its core lending business.
Asset Quality Improves as Bad-Loan Ratios Fall
Asset quality remains a central indicator for public-sector banks because bad loans can reduce earnings, tie up capital and increase provisioning requirements.
PNB reported an improvement in both its gross and net non-performing asset ratios.
| Asset-quality metric | Q2 FY27 | Q2 FY26 | Direction |
|---|---|---|---|
| Gross NPA ratio | 2.55% | 3.45% | Improved |
| Net NPA ratio | 0.25% | 0.36% | Improved |
| Provision coverage ratio, including technical write-offs | 97.32% | 96.91% | Improved |
| Slippage ratio | 0.77% | 0.71% | Increased |
Figures reflect reported year-on-year comparisons. The slippage ratio measures fresh additions to stressed loans relative to the relevant advances base, as defined in the bank’s reporting.
The GNPA ratio measures the share of gross advances classified as non-performing, while the NNPA ratio reflects bad loans after adjusting for provisions. Lower ratios generally indicate an improvement in the reported loan portfolio.
PNB’s gross NPA ratio declined by 90 basis points year-on-year to 2.55%. Its net NPA ratio fell to 0.25% from 0.36%.
The provision coverage ratio, including technical write-offs, increased to 97.32%. This indicates that provisions and technical write-offs covered a high proportion of the bank’s reported gross non-performing assets under the stated measure.
However, the slippage ratio rose from 0.71% to 0.77%. This suggests that fresh additions to stressed loans remain an area to monitor even as the overall bad-loan ratios improve. A sustained decline in NPAs alongside controlled slippages would provide stronger evidence that asset-quality gains are durable.
Credit Growth: Retail, Agriculture and MSMEs Expand
PNB’s lending growth was broad-based across several categories, with MSME and retail lending showing particularly strong increases.
| Lending category | September 2026 balance | Year-on-year growth |
|---|---|---|
| Global advances | ₹13.41 lakh crore | +14.7% |
| Retail advances, excluding IBPC | — | +16.3% |
| Housing loans | ₹1,41,836 crore | +14.3% |
| Vehicle loans | ₹38,234 crore | +29.6% |
| Agriculture advances | ₹1,71,156 crore | +18.1% |
| MSME advances | ₹2,14,619 crore | +19.8% |
Source: PNB Q2 FY27 results coverage. A dash indicates that a comparable balance was not included in the cited figures.
MSME lending grew 19.8% to ₹2.15 lakh crore, highlighting the bank’s exposure to small and medium-sized businesses. Agriculture advances increased 18.1% to ₹1.71 lakh crore, while retail advances excluding inter-bank participation certificates rose 16.3%.
Vehicle loans recorded growth of 29.6%, faster than housing loans, which increased 14.3%.
These figures suggest that PNB is expanding credit across household and business segments. But lending growth must be assessed alongside underwriting standards, repayment performance and the cost of funding. Rapid loan expansion can support revenue, but it can also increase risk if borrower quality weakens.
Deposits Increase 9.9%, CASA Ratio Stands at 36.6%
PNB’s global deposits rose 9.9% year-on-year to ₹17.77 lakh crore. Global advances grew faster, at 14.7%, reaching ₹13.41 lakh crore.
The difference between deposit and advance growth matters because banks need stable funding to support lending. When loans grow faster than deposits, a lender may need to attract more deposits, manage liquidity carefully or rely on other permitted funding sources.
The bank’s current account and savings account (CASA) deposits rose 7.3% to ₹6.26 lakh crore. PNB reported a CASA share of 36.6% as of September 2026.
CASA deposits are generally important because current and savings accounts can provide a relatively lower-cost funding base compared with some other deposit products. Their cost advantage, however, depends on prevailing rates and customer behaviour.
PNB’s ability to maintain deposit growth while expanding advances will remain important for its margins and liquidity position. Investors will also monitor whether the bank must offer higher deposit rates to attract funds in a competitive banking market.
What the Results Mean for PNB Investors
The results present a combination of higher profit, stronger NII, credit expansion and improved headline asset-quality ratios. Those are important indicators for investors assessing the bank’s operating performance.
However, one quarter cannot establish the direction of earnings for the full year. Investors will also consider the bank’s valuation, return on assets, return on equity, capital adequacy, provisions, deposit costs and management guidance.
PNB’s return on assets remained at 1.05%, according to the reported results. The slippage ratio also rose year-on-year, making fresh bad-loan formation a metric to watch alongside the decline in the GNPA and NNPA ratios.
The bank’s shares closed at ₹116.30 on the NSE on October 16, up 1.09% during the session. The results were announced after market hours, so that closing price should not be interpreted as the market’s reaction to the earnings release.
The next trading sessions will show how investors assess the balance between earnings growth, asset quality, funding costs and the bank’s valuation. Share-price movements cannot be inferred from the results alone.
The Bigger Picture
PNB’s Q2 FY27 performance reflects continued expansion in lending and an improvement in reported asset quality. Net profit grew 12.8%, NII rose 10.8% and global advances increased 14.7%. The lower GNPA and NNPA ratios provide additional support to the earnings picture, although the higher slippage ratio suggests that the bank still needs to manage fresh credit stress carefully.
The key challenge will be sustaining profitable growth without allowing loan expansion to weaken funding or underwriting quality. Deposit mobilisation, net interest margins, provisions and fresh slippages will help determine whether the latest performance can be maintained in subsequent quarters.
Looking Ahead
PNB’s future performance will depend on its ability to maintain NII growth, manage deposit costs and continue improving asset quality. Strong demand from retail borrowers, agriculture and MSMEs provides opportunities for further credit expansion, but the bank will need to balance growth with prudent lending and adequate provisions. Its NIM and slippage ratio will be particularly useful indicators to track in the next results.
For investors, the latest quarter provides evidence of continued earnings growth but does not, by itself, establish whether PNB shares are attractively valued. The bank’s next set of results, capital position, funding costs and credit trends will offer a fuller picture of its financial trajectory.
Frequently Asked Questions
1. What was PNB’s net profit in Q2 FY27?
Punjab National Bank reported net profit of ₹5,532 crore for the quarter ended September 30, 2026, up 12.8% from ₹4,904 crore in Q2 FY26.
2. How much did PNB’s net interest income grow?
Net interest income increased 10.8% year-on-year to ₹11,601 crore.
3. What was PNB’s gross NPA ratio in Q2 FY27?
The gross NPA ratio stood at 2.55%, down from 3.45% a year earlier. The net NPA ratio declined to 0.25% from 0.36%.
4. What was PNB’s global advances growth?
Global advances increased 14.7% year-on-year to ₹13.41 lakh crore as of September 2026.
5. What was PNB’s net interest margin?
PNB’s global net interest margin was 2.58% in Q2 FY27, compared with 2.50% in the preceding quarter.
6. Did PNB’s slippage ratio improve?
No. The slippage ratio increased to 0.77% from 0.71% a year earlier. This is worth monitoring even though the bank’s overall gross and net NPA ratios improved.
Primary sources: PNB financial-results press release, October 16, 2026. The release supports the reported current-quarter results.
Clarification, October 16, 2026: The CASA passage now states the bank-reported share without describing it as a percentage of global total deposits.
Get the day’s top stories in your inbox
One concise email. No spam, unsubscribe anytime.


