
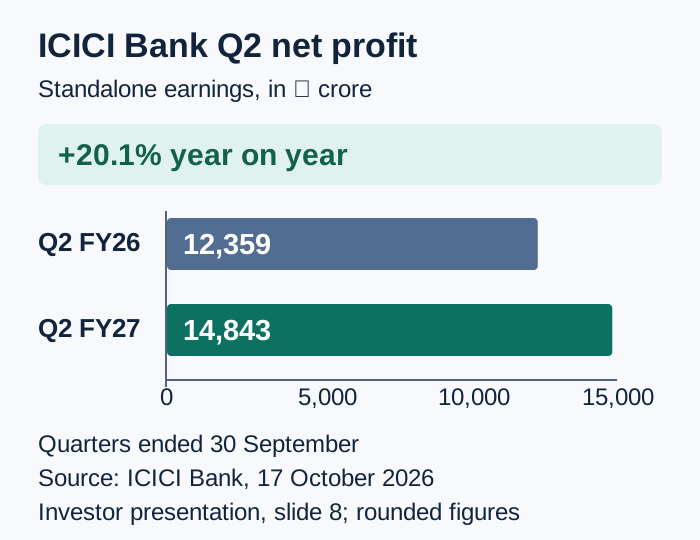
ICICI Bank reported a 20.1% year-on-year increase in standalone net profit to ₹14,843 crore for the second quarter of financial year 2026–27, supported by stronger net interest income, lower provisions and improving asset quality. Net interest income (NII), which measures the difference between interest earned on loans and interest paid on deposits and borrowings, increased 17.7% to ₹25,339 crore in the quarter ended September 30, 2026. Provisions for potential loan losses declined about 7% to ₹851 crore, helping support the bank’s earnings.
The results also showed continued expansion in lending and deposits, alongside a reduction in non-performing assets. However, net interest margin (NIM), a key indicator of lending profitability, fell to 4.18% from 4.30% a year earlier and 4.36% in the previous quarter. Separately, ICICI Bank’s consolidated net profit rose 22.3% to ₹16,333 crore. The distinction between standalone and consolidated earnings is important when interpreting the results, as the two measures cover different parts of the banking group.
Key Takeaways
- Standalone net profit: Rose 20.1% year-on-year to ₹14,843 crore.
- Consolidated net profit: Increased 22.3% to ₹16,333 crore.
- Net interest income: Grew 17.7% to ₹25,339 crore.
- Provisions: Declined about 7% year-on-year to approximately ₹851 crore.
- Net interest margin: Fell to 4.18%, compared with 4.30% a year earlier.
- Asset quality: Gross NPA ratio improved to 1.20% from 1.58% a year earlier.
- Loan growth: The total loan portfolio expanded 30% year-on-year, although growth was 24.1% excluding lending linked to FCNR(B) deposits.
- Deposits: Increased 27.1% year-on-year to ₹20.50 lakh crore.
ICICI Bank Q2 FY27 Results: Key Numbers
The September-quarter results reflect growth in the bank’s core lending business and lower provisions for bad loans. The following table summarises the major financial and operating indicators.
| Metric | Q2 FY27 | Year-on-year comparison |
|---|---|---|
| Standalone net profit | ₹14,843 crore | +20.1% |
| Consolidated net profit | ₹16,333 crore | +22.3% |
| Net interest income | ₹25,339 crore | +17.7% |
| Core operating profit | ₹20,805 crore | +21.8% |
| Provisions | ₹851 crore | -about 7% |
| Total loan portfolio | ₹18.32 lakh crore | +30% |
| Period-end deposits | ₹20.50 lakh crore | +27.1% |
| Net interest margin | 4.18% | 4.30% in Q2 FY26 |
| Gross NPA ratio | 1.20% | 1.58% in Q2 FY26 |
| Net NPA ratio | 0.30% | 0.39% in Q2 FY26 |
Source: ICICI Bank’s quarterly results and financial reporting published on October 17, 2026. Figures are rounded.
Net Profit Rises as Provisions Decline
ICICI Bank’s standalone profit increased from approximately ₹12,359 crore in the corresponding quarter of the previous financial year to ₹14,843 crore in Q2 FY27.
A major contributor was the decline in provisions for potential loan losses. Banks set aside provisions to cover loans that may not be repaid in full. These expenses reduce reported profit, so a decline can support earnings when the underlying credit portfolio remains healthy.
ICICI Bank’s provisions fell to approximately ₹851 crore from ₹914 crore a year earlier. This reduction helped the bank convert stronger operating performance into higher net profit.
However, lower provisions do not independently establish that credit risk has disappeared. Provisioning requirements can change with borrower performance, recoveries, write-offs and management assessments. Investors generally examine provisions alongside non-performing asset ratios and fresh defaults to understand the wider credit picture.
The reported profit also exceeded the analyst consensus cited by Reuters, indicating that earnings came in above expectations. The result was supported by loan growth and the reduction in provisions, although future performance will depend on the sustainability of lending income, operating costs and credit quality.
Net Interest Income Grows 17.7%
Net interest income increased to ₹25,339 crore from ₹21,529 crore in the year-ago quarter. The increase reflects expansion in the bank’s lending business and the interest it earns from loans and other interest-bearing assets.
NII is one of the most important measures for a bank because it captures the difference between interest revenue and interest expenses. Banks earn interest on loans but must also pay interest on deposits and borrowings used to fund those loans.
When lending grows, NII can increase if the bank maintains a healthy spread between lending yields and funding costs. But rapid loan growth alone does not guarantee stronger margins. Banks must compete for deposits, manage funding costs and balance lending across different products and customer segments.
ICICI Bank’s core operating profit rose 21.8% year-on-year to ₹20,805 crore. Fee income increased 20.1% to ₹7,795 crore, while operating expenses rose 8.5% to ₹12,811 crore, according to detailed quarterly reporting.
The combination of NII growth, higher fee income and controlled growth in operating expenses supported the bank’s operating performance. It also shows why the earnings improvement cannot be attributed solely to lower provisions.
Net Interest Margin Falls to 4.18%
Despite higher NII, ICICI Bank’s net interest margin declined to 4.18% in Q2 FY27 from 4.30% in the same quarter last year and 4.36% in Q1 FY27.
NIM measures the net interest income a bank generates relative to its interest-earning assets. It is an important indicator of how effectively a lender converts its assets and funding base into interest earnings.
A falling NIM can reflect higher deposit costs, changes in loan pricing, shifts in the mix of assets or other balance-sheet factors. In a competitive banking market, lenders may have to offer attractive deposit rates to retain customers while also facing pressure on the interest rates they can charge borrowers.
The sequential decline also needs context. ICICI Bank received a benefit from interest on a tax refund in the June quarter, which contributed approximately eight basis points to the reported Q1 margin. Excluding that benefit, the underlying sequential decline was smaller than the headline comparison suggests.
Nevertheless, margin performance remains important. If NIM continues to contract, the bank may need stronger loan growth, fee income or operating efficiency to sustain earnings growth.
Loan and Deposit Growth Support Expansion
ICICI Bank’s total loan portfolio increased 30% year-on-year to ₹18.32 lakh crore. The bank also reported period-end deposits of ₹20.50 lakh crore, up 27.1% from a year earlier.
Loans and deposits are closely linked in a bank’s business model. Deposits provide a major source of funding for lending, while loans generate interest income. Growth in both can support expansion, but banks must ensure that funding remains stable and that lending standards do not weaken as credit demand increases.
The headline loan growth figure requires some context. After excluding lending linked to FCNR(B) deposits, loan growth was 24.1%. FCNR(B) refers to Foreign Currency Non-Resident (Bank) deposits, a type of deposit account available to eligible non-resident Indians. Lending associated with such deposits can affect comparisons of the bank’s overall growth rate.
Deposit growth also moderated when certain categories were excluded. The bank reported 17% growth in deposits excluding FCNR(B)-related deposits. These adjusted figures help investors distinguish broader customer growth from changes associated with specific funding arrangements.
The expansion in loans and deposits indicates continued business growth, but the bank must maintain an appropriate balance between lending opportunities, deposit mobilisation and liquidity management.
Asset Quality Improves as Bad-Loan Ratios Decline
ICICI Bank reported an improvement in both gross and net non-performing asset ratios during the quarter.
The gross NPA ratio fell to 1.20% as of September 30, 2026, from 1.58% a year earlier and 1.38% at the end of June. The net NPA ratio declined to 0.30% from 0.39% a year earlier and 0.35% in the previous quarter.
Non-performing assets are loans where borrowers have stopped meeting repayment obligations according to the applicable regulatory classification rules. The gross NPA ratio measures these loans before accounting for provisions, while the net NPA ratio reflects the position after relevant provisions are deducted.
Lower ratios generally indicate an improvement in the reported quality of the loan book. However, investors also monitor fresh NPA additions, recoveries, upgrades and write-offs to understand whether the improvement reflects better borrower performance or other balance-sheet movements.
During Q2 FY27, gross NPA additions stood at ₹4,833 crore, compared with ₹5,034 crore in the corresponding quarter a year earlier. The bank also reported recoveries and upgrades, excluding write-offs and sales, of ₹3,620 crore.
The improvement in the NPA ratios, combined with lower provisions, supported the quarterly earnings outcome. Maintaining this trend will remain important as the loan portfolio expands.
What the Results Mean for Investors
ICICI Bank’s results present a combination of strong profit growth, higher core operating income and improving asset quality. The 20.1% increase in standalone net profit exceeded the consensus estimate cited by Reuters, while NII grew at a healthy pace.
At the same time, the decline in NIM highlights a potential pressure point. Investors will need to assess whether the bank can continue expanding its loan book without facing excessive increases in deposit costs or a sustained reduction in lending spreads.
The quality of loan growth also matters. Growth supported by stable deposits, disciplined underwriting and manageable credit costs is different from growth that relies on unusually expensive funding or looser lending standards.
For shareholders, the quarterly report provides information about the bank’s operating performance, but it does not by itself determine whether the stock is attractively valued. Share prices also reflect expectations about future earnings, interest rates, competition, credit demand and broader market conditions.
The Bigger Picture
ICICI Bank’s Q2 FY27 results show how a lender can report higher earnings even as a key profitability ratio declines. Stronger NII, higher fee income and lower provisions supported the bottom line, while the improvement in NPA ratios pointed to better reported asset quality. These factors provide a more complete explanation of the earnings increase than net profit alone.
The next phase will test whether the bank can sustain loan and deposit growth while stabilising margins. Funding costs, customer deposit behaviour, credit quality and the wider interest-rate environment will shape future results. The bank’s ability to balance expansion with disciplined risk management will remain central to its financial performance.
Looking Ahead
ICICI Bank will need to monitor the pressure on NIM as competition for deposits and lending opportunities continues. Management’s outlook for margins, loan growth and credit costs will be important indicators in subsequent quarters, particularly after the tax-refund benefit that supported the previous quarter’s reported margin largely disappears.
Investors will also watch whether the improvement in asset quality continues as the loan portfolio grows.
Editorial note, 17 October 2026: An incomplete sentence at the end of this article was removed. No missing wording has been reconstructed.
Update, October 17, 2026: The provisions decline has been rounded to about 7%, consistent with the 7.0% decrease reported on slide 8 of ICICI Bank’s Q2 FY27 presentation.
Source check: how to read the quarter
In its Q2 FY27 investor presentation, ICICI Bank reports loan growth of 24.1% after excluding loans made by international branches against FCNR(B) deposits, versus headline growth of 30.0%. The presentation also says the tax-refund interest contribution to margin was negligible this quarter, after eight basis points in Q1 FY27. These distinctions help compare underlying growth and margins across periods.
Get the day’s top stories in your inbox
One concise email. No spam, unsubscribe anytime.


