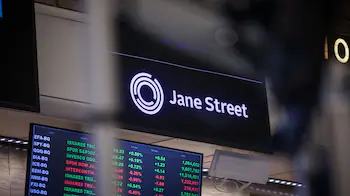
Jane Street suffered an estimated $15 billion loss in July 2026, marking the trading firm’s worst monthly performance and its first negative trading month since 2016. The unusually large setback was linked primarily to the collapse of positions connected to Situational Awareness, an AI-focused hedge fund backed by Jane Street, as well as losses on technology and Asian equity positions during a sharp market selloff.
Despite the unprecedented monthly loss, Jane Street’s broader financial position remains strong. The firm has generated more than $40 billion in net trading revenue so far this year, already exceeding its full-year 2025 trading revenue of $39.6 billion. The July episode nevertheless represents a major reversal for one of the world’s most successful proprietary trading firms and has prompted it to reduce risk across several strategies.
Jane Street’s July Loss Reaches $15 Billion
Jane Street’s approximately $15 billion loss in July represents an extraordinary reversal for a firm that has built its reputation around quantitative trading, market making and sophisticated risk management.
The loss was revealed by people familiar with the firm’s results and in an internal communication to employees.
The firm’s trading revenue fell about 25% from June, according to reports, as a broad selloff in AI-related and Asian technology stocks hit several of its positions simultaneously.
| Jane Street Metric | July / 2026 |
|---|---|
| Estimated July loss | ~$15 billion |
| 2026 net trading revenue so far | >$40 billion |
| 2025 full-year trading revenue | $39.6 billion |
| First negative month since | 2016 |
| July revenue change vs June | ~-25% |
| Situational Awareness exposure | Major source of losses |
The size of the loss makes July an exceptional event even by the standards of a firm that handles enormous trading positions across global markets.
Situational Awareness Exposure Was a Major Factor
One of the biggest contributors to the loss was Jane Street’s investment in Situational Awareness, an AI-focused hedge fund founded by former OpenAI researcher Leopold Aschenbrenner.
The fund had performed exceptionally well during the first half of 2026, attracting substantial capital and building large positions in AI-related stocks.
Jane Street increased its exposure as the fund’s performance strengthened.
However, the situation changed dramatically in July when AI-linked equities suffered a sharp selloff.
Situational Awareness Investment Cycle
Strong AI performance → Situational Awareness gains → Fund assets expand → Jane Street increases exposure → AI stocks reverse sharply → Fund suffers drawdown → Jane Street’s investment loses value → Major July loss
Jane Street said its stake in Situational Awareness remained profitable over the full duration of the investment, even though the July drawdown largely erased its gains for the year.
AI Stock Selloff Amplified the Damage
For more context, see Jane Street Swaps $5.6B Bonds for $14.6B Senior Secured Notes.
The problems at Situational Awareness were accompanied by a broader decline in AI-related and technology stocks.
Several semiconductor and memory-chip companies experienced steep declines during July.
Jane Street had long positions in some of these companies, meaning falling stock prices directly affected the value of its positions.
| Market Factor | Impact on Jane Street |
|---|---|
| AI stock selloff | Significant losses |
| Semiconductor decline | Significant losses |
| Asian technology stocks | Losses |
| Situational Awareness drawdown | Major investment hit |
| Gradual market decline | Hedges less effective |
| De-risking | Reduced future exposure |
The simultaneous decline across several related positions made the losses particularly severe.
Asian Technology Stocks Added to the Losses
Jane Street’s July problems were not limited to artificial intelligence.
The firm also lost money on long positions in Asian companies that were not directly connected to AI.
Many of these stocks had been among the firm’s successful positions earlier in the year.
The reversal therefore affected some of the same trades that had generated strong returns during the second quarter.
Second-Quarter Winners Become July Losers
Q2 performance → Strong gains in Asian technology
+
AI-linked stocks
Positions become large → Market regime changes → July selloff → Previously profitable positions decline → Large losses
This illustrates the difficulty of managing concentrated positions after a period of unusually strong performance.
Jane Street’s Hedges Failed to Fully Protect It
Jane Street is known for sophisticated hedging and risk-management systems.
However, the July decline developed gradually rather than through a single sudden market crash.
That limited the effectiveness of some of its hedges.
When markets move sharply but correlations behave differently from historical patterns, even sophisticated quantitative strategies can experience unexpected losses.
Risk-Management Challenge
Large positions → Market moves gradually → Hedges provide limited protection → Related assets decline together → Correlations increase → Multiple strategies lose simultaneously
The July episode therefore represents a significant test of Jane Street’s risk-management framework.
First Negative Trading Month Since 2016
The July loss is particularly notable because Jane Street had not recorded a negative trading month since 2016.
That means the firm had maintained nearly a decade of monthly trading profitability before the latest setback.
Trading Performance Record
2016 → Last known negative month → 2017–2025 → Consistently profitable months → 2026 → July loss → ~$15 billion
The event does not necessarily indicate a breakdown in the firm’s overall business model, but it demonstrates that even highly diversified quantitative trading operations remain exposed to extreme market regimes.
Jane Street Still Has More Than $40 Billion in 2026 Revenue
The scale of the July loss needs to be considered alongside Jane Street’s broader performance.
The firm has generated more than $40 billion in net trading revenue through July 2026.
That figure already exceeds its full-year trading revenue of $39.6 billion in 2025.
| Trading Revenue | Amount |
|---|---|
| 2025 full year | $39.6 billion |
| 2026 through July | >$40 billion |
| July loss | ~$15 billion |
This means Jane Street’s underlying trading operation had generated enormous revenue before the July reversal.
The firm therefore enters the second half of the year from a much stronger position than the size of the monthly loss alone might suggest.
The $15 Billion Loss Is Not the Same as $15 Billion of Annual Losses
It is important to distinguish a monthly trading loss from a full-year accounting loss.
Jane Street’s reported figure reflects the estimated impact of trading and investment positions during July.
The firm’s year-to-date results include substantial gains from earlier months.
Annual Performance Context
Strong gains earlier in 2026 → More than $40 billion net trading revenue → July market reversal → ~$15 billion monthly loss → Year-to-date performance remains substantial
The final full-year result will depend on trading performance during the remaining months of 2026.
Jane Street Has Started Reducing Risk
Following the July losses, Jane Street has taken steps to reduce its exposure to some of the strategies that performed poorly.
The firm has closed a significant portion of positions in areas where it suffered losses.
It has also become more selective about risk-taking across other strategies.
Post-Loss Strategy
July losses → Identify weak positions → Close part of exposure → Reduce risk → Reassess correlations → More selective trading → Rebuild positions selectively
This response is designed to prevent the July market regime from producing another similar drawdown.
The Situational Awareness Investment Has Not Been a Complete Loss
Although Situational Awareness suffered a major setback, Jane Street’s investment was not necessarily wiped out.
The firm’s internal communication indicated that the investment remained profitable over the full duration of its involvement, although the July decline left its position roughly flat for the year.
This distinction is important.
Investment Performance
Initial investment → Strong first-half performance → Investment value increases → Jane Street increases exposure → July AI selloff → Investment value falls sharply → Year-to-date gain largely erased → Investment remains positive over full holding period
The episode nevertheless demonstrates the risks of increasing exposure after a period of exceptional performance.
Situational Awareness Faced Margin Pressure
The AI hedge fund experienced a major drawdown as its leveraged positions fell.
The decline forced the fund to liquidate much of its public-equity portfolio.
Citadel acquired a large portion of the assets as the portfolio was unwound.
Forced Selling Cycle
AI stocks fall → Portfolio value declines → Leverage increases relative to assets → Margin pressure → Positions sold → More market supply → Additional downward pressure → Portfolio liquidation
The forced selling contributed to the broader market disruption surrounding some AI-linked securities.
Leverage Increased the Speed of the Downturn
Leverage can amplify both gains and losses.
When a highly leveraged portfolio performs well, returns can rise quickly.
When markets reverse, however, falling asset values can trigger margin calls and forced selling.
Leverage Effect
Asset prices rise → Borrowed capital amplifies returns → Portfolio expands → Market reverses → Asset values fall → Margin requirements increase → Positions liquidated → Losses accelerate
This dynamic helps explain why the reversal in July was so severe for some AI-focused investors.
Jane Street’s Business Is Different From a Traditional Bank
Jane Street is primarily known as a proprietary trading and market-making firm.
Its business involves providing liquidity across financial markets and using quantitative strategies to trade securities.
This differs from a traditional commercial bank, where earnings are heavily dependent on lending and interest income.
Jane Street Business Model
Market data
+
Quantitative models
+
Trading technology
+
Global liquidity
↓
Market making
+
Proprietary strategies
↓
Trading revenue
The model can produce extremely high returns during favourable market conditions but can also expose the firm to significant trading losses.
Why Jane Street Matters to Financial Markets
Jane Street operates across global financial markets and provides liquidity to investors.
Its activities span equities, ETFs, options, futures, bonds, currencies and other financial instruments.
Large market makers can help keep markets functioning efficiently by continuously providing bids and offers.
Market-Making Function
Investor wants to sell → Jane Street provides bid → Investor sells → Jane Street manages position → Risk is hedged or traded
This business requires sophisticated technology, large amounts of capital and highly skilled quantitative teams.
The July Loss Shows the Limits of Diversification
Jane Street trades across many markets, but July demonstrated that diversification can become less effective when multiple assets fall together.
AI stocks, semiconductor companies and Asian technology shares became increasingly correlated during the selloff.
Correlation Risk
Different assets → Different companies → Different markets → Normally diversified
BUT → AI-driven market selloff → Correlations rise → Multiple positions decline simultaneously → Diversification weakens
This is a key lesson for quantitative trading firms and institutional investors.
Why AI Became a Concentrated Market Theme
AI-related stocks had attracted enormous investor interest during the first half of 2026.
Companies linked to chips, data centres, cloud infrastructure and AI software benefited from strong expectations around AI spending.
That created significant opportunities for investors but also increased the concentration of capital around a relatively narrow group of companies.
AI Investment Cycle
AI enthusiasm → Higher stock prices → More capital → Larger positions → Higher valuations → Crowded trades → Market reversal → Sharp losses
The July selloff showed what can happen when crowded trades unwind simultaneously.
Semiconductor Stocks Were Particularly Vulnerable
Semiconductor companies were among the stocks affected by the July downturn.
Some major memory and semiconductor names reportedly declined by roughly 50% during the period.
For investors with large long positions, such moves can create enormous losses in a short period.
Semiconductor Risk
Large AI demand expectations → High valuations → Crowded positions → Earnings / sentiment shock → Sharp stock declines → Portfolio losses
Jane Street’s exposure to this segment contributed to the broader reversal.
Jane Street’s Capital Strength Remains Important
Despite the July loss, Jane Street remains a highly capitalised trading firm with substantial revenue generation.
Its ability to absorb a large monthly loss without immediately threatening its core operations reflects the scale of its business.
However, the episode could still affect how the firm approaches risk, leverage and concentrated investments.
Capital Buffer
Large trading revenue
+
Large capital base
Absorb losses → Maintain market-making operations → Reduce risky positions → Continue trading
The firm’s response will be closely watched by other market participants.
What the Loss Means for AI Investors
The Jane Street episode is another warning that the AI investment trade can create significant concentration risk.
The long-term outlook for artificial intelligence may remain strong, but individual companies and sectors can experience severe volatility.
Investors should therefore distinguish between confidence in AI’s structural growth and short-term valuation risks.
AI Investment Risk
Long-term AI adoption
+
Short-term market expectations
+
High valuations
+
Leverage
+
Crowded positions
↓
Potential volatility
The July events demonstrate that strong long-term fundamentals do not prevent large short-term losses.
Broader Lessons for Hedge Funds
Jane Street’s loss could encourage hedge funds and trading firms to reassess their exposure to crowded technology trades.
Key areas of focus may include:
- Position sizing
- Leverage
- Correlation risk
- Liquidity
- Hedging effectiveness
- Concentration
- Stress testing
- Counterparty exposure
Risk Management Checklist
Position size → Leverage → Liquidity → Correlation → Hedges → Stress testing → Capital requirements → Risk-adjusted returns
The goal is not simply to avoid losses but to ensure that extreme losses do not threaten the broader business.
What Investors Should Watch Next
The key question is whether July represents an isolated event or the beginning of a more prolonged period of volatility.
Jane Street’s future results will depend on how quickly its strategies adapt to the changed market environment.
Important indicators include:
- Trading revenue
- Risk exposure
- AI-related positions
- Asian equity exposure
- Market volatility
- Liquidity conditions
- Leverage
- Hedge performance
Jane Street Recovery Dashboard
Risk reduced → Positions stabilised → Market volatility → Trading opportunities → Revenue recovery → Capital rebuilding
The firm’s enormous trading infrastructure could allow it to recover quickly if market conditions become favourable again.
Key Numbers at a Glance
| Metric | Figure |
|---|---|
| Estimated July loss | ~$15 billion |
| First negative month since | 2016 |
| 2026 net trading revenue so far | >$40 billion |
| 2025 full-year trading revenue | $39.6 billion |
| July revenue change from June | ~25% decline |
| Major investment involved | Situational Awareness |
| Major market exposure affected | AI and Asian technology stocks |
| Reported response | Reduced risk and closed positions |
Infographic: How Jane Street Lost $15 Billion
“`text
AI BOOM
│
▼
AI STOCKS RALLY
│
▼
SITUATIONAL AWARENESS GROWS
│
▼
JANE STREET INCREASES
EXPOSURE
│
▼
JULY AI SELLOFF
│
┌────────────┴────────────┐
▼ ▼
AI / SEMICONDUCTOR ASIAN EQUITIES
STOCKS FALL FALL
│ │
└────────────┬────────────┘
▼
MULTIPLE LOSSES
│
▼
~ $15 BILLION
JULY LOSS
│
▼
RISK REDUCTION
Frequently Asked Questions
How large was Jane Street’s July loss?
About $15 billion.
Was this unusual for the firm?
Yes. It was Jane Street’s first negative trading month since 2016.
What drove the loss?
Situational Awareness exposure was a major factor, amplified by an AI stock selloff and losses in Asian technology stocks.
Get the day’s top stories in your inbox
One concise email. No spam, unsubscribe anytime.


